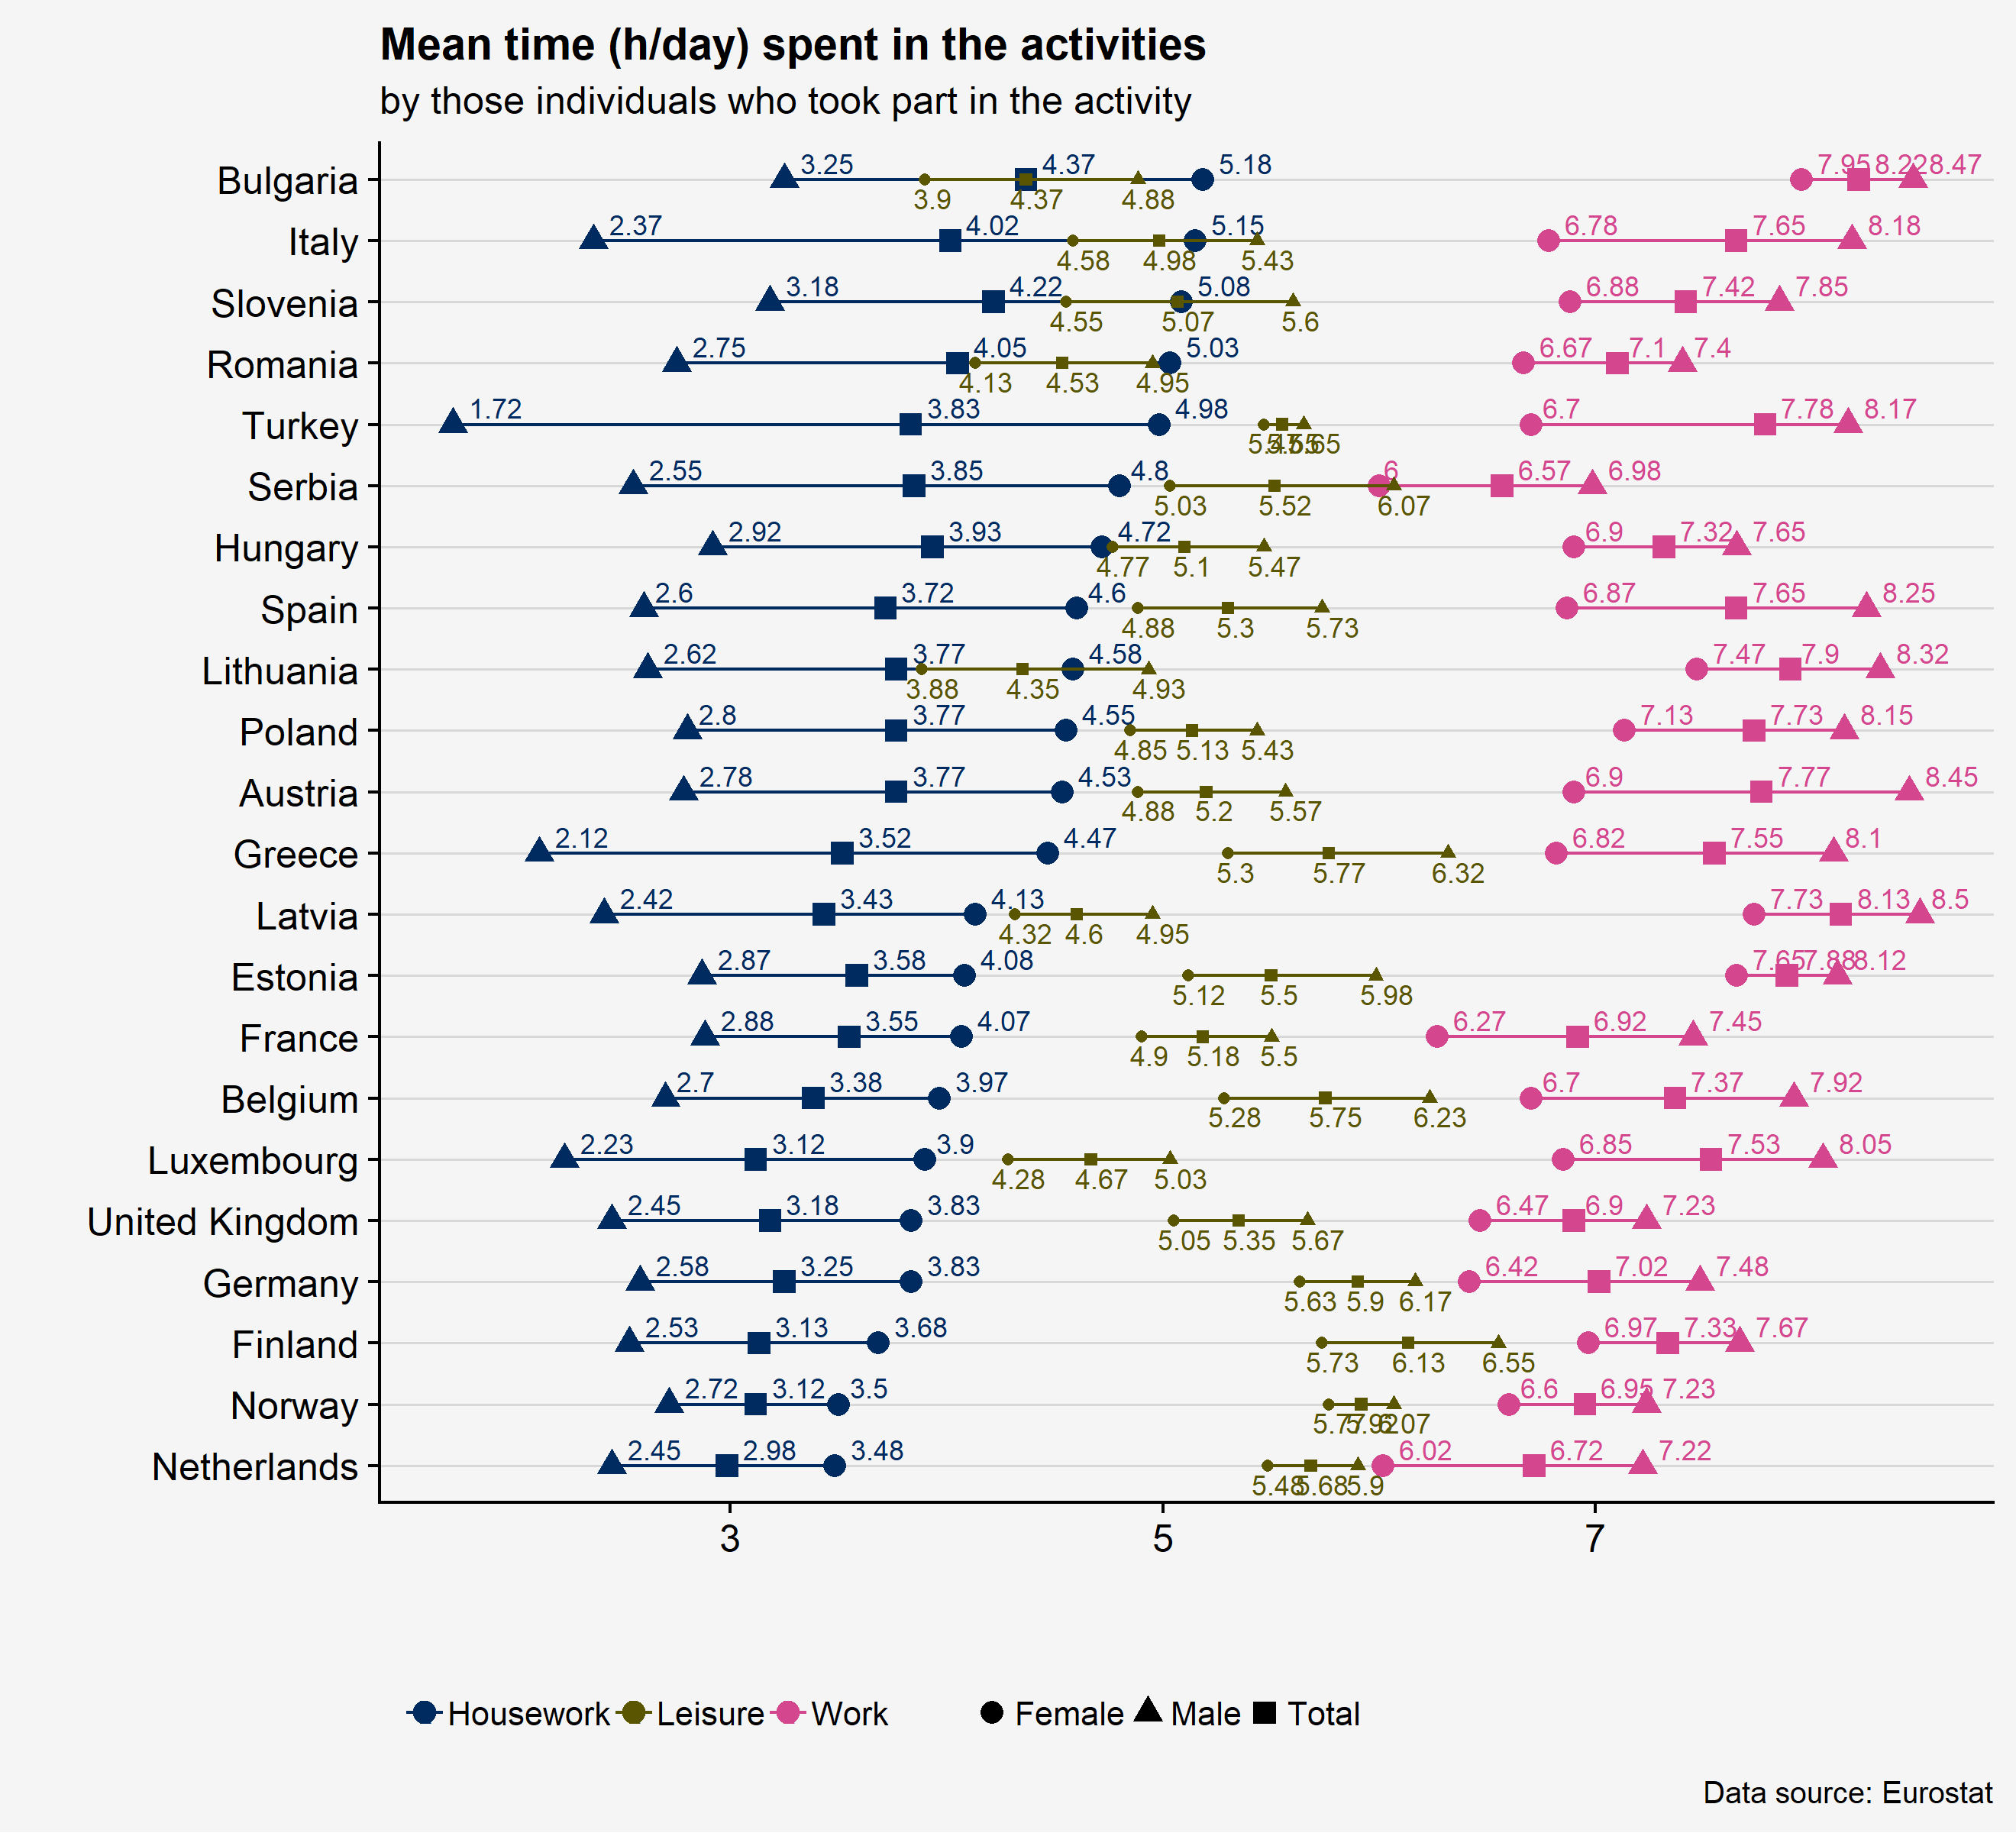
Domestic work so often unseen and underestimated might be valued “at 13 per cent of Global GDP” (UNWomen). For some countries the estimates go up to 60% (UK, CH). Most of the domestic work is still done by women in exchange for “lower” working hours in official job. As a result, usually women end up working more in total and thus having a less time for leisure. To look at this problem I have decided to analyse Eurostat data from time-use surveys.
Continue reading
Asylum seekers

Goal: visualize first instance decisions on applications by citizenship, age and sex annual aggregated data from Eurostat. Load libraries:

library(eurostat) library(data.table) library(tidyr) library(magrittr) library(plyr) library(dplyr) library(rjson) library(viridisLite) library(highcharter) Download the data:

if(!file.exists("data_asylum.Rdata")){ data <- "migr_asydcfsta" %>% get_eurostat %>% data.table save(data, file="data_asylum.Rdata") } load("data_asylum.Rdata") dic <- lapply(names(data), get_eurostat_dic) eumap <- rjson::fromJSON(file = "http://code.highcharts.com/mapdata/custom/europe.geo.json", method = 'C') for (i in 1:length(eumap$features)) { names(eumap$features[[i]][[3]])[names(eumap$features[[i]][[3]]) %in% "iso-a2"] <- "code" } data[, period := year(time)] data[, time := NULL] data <- data[age %in% "TOTAL" & decision %in% c("TOTAL", "REJECTED") & citizen %in% "TOTAL" & sex %in% "T", ] data[, geo1 := as.


Continue reading

In 2015 I was working on my master thesis “The integration of (QU)AIDS and input-output analysis in a panel data setting” and had to analyse the structure of household expenditure. I stumbled open several visualizations in The Economist (World and EU) while searching for information on this topic. Thinking that they looked great I wanted to replicate these with R. The way I chose to do it is based on the question in stackoverflow.
Continue reading

Author's picture

Simona Jokubauskaite

Statistician, MSc

University of Natural Resources and Life Sciences, Vienna

Austria