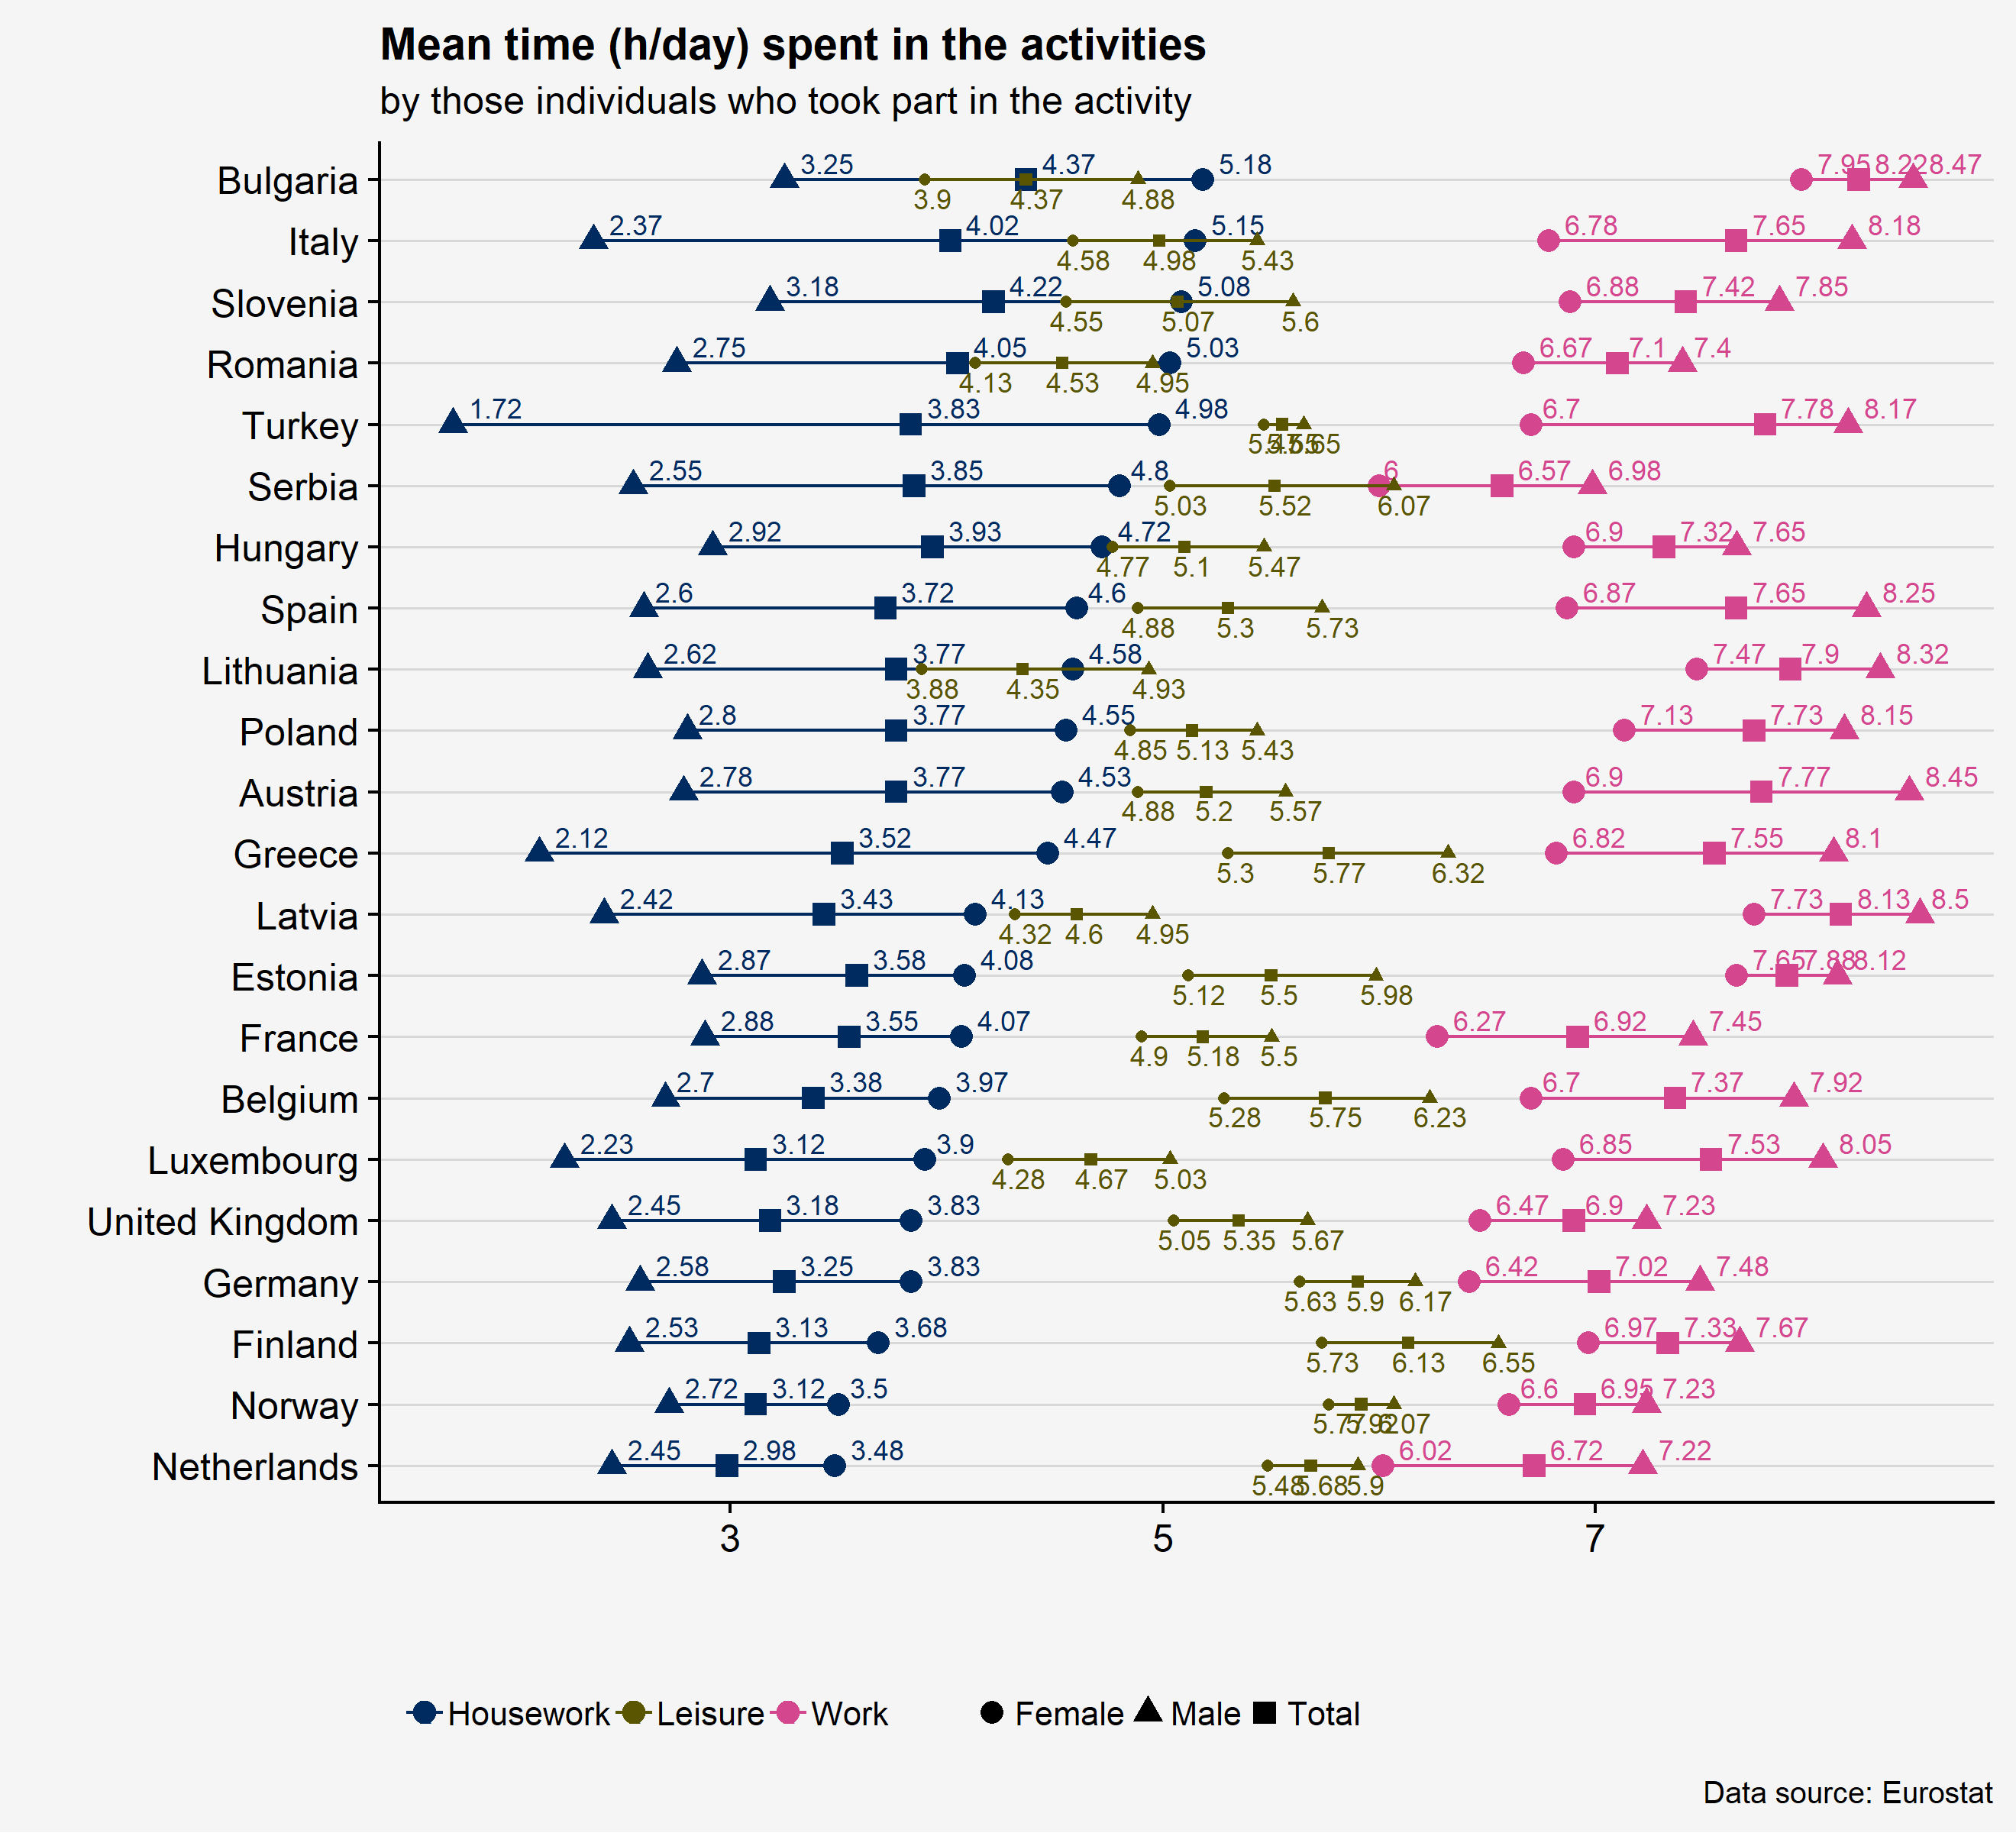
Domestic work so often unseen and underestimated might be valued “at 13 per cent of Global GDP” (UNWomen). For some countries the estimates go up to 60% (UK, CH). Most of the domestic work is still done by women in exchange for “lower” working hours in official job. As a result, usually women end up working more in total and thus having a less time for leisure. To look at this problem I have decided to analyse Eurostat data from time-use surveys.
Continue reading

Amazed by the election advertisements in Austria, I have decided to get my hands dirty and do some analyses about the forthcoming election. derStandard decided to have discussions why Austrians are electing FPÖ, Neos, and ÖVP. Strangely enough I did not find a discussion on SPÖ. To get the postings I used wonderful RSelenium, for data cleaning tm, and for visualization wordcloud. FPÖ - 1963 posts Neos - 875 postings
Continue reading

So today I have submitted my first article for review. We have calculated some interesting time indicators for Austria, such as value of leisure (VoL). Although, this work is partially done, it left me with a lot of questions. The used theoretical model takes into account only the official/paid work, but the domestic/unpaid work is not considered as a “real” work, as it does not generate any money. In our sample women work 8 hours less than men, but they are involved in 9 hours more of domestic work.
Continue reading

Asylum seekers

Goal: visualize first instance decisions on applications by citizenship, age and sex annual aggregated data from Eurostat. Load libraries:

library(eurostat) library(data.table) library(tidyr) library(magrittr) library(plyr) library(dplyr) library(rjson) library(viridisLite) library(highcharter) Download the data:

if(!file.exists("data_asylum.Rdata")){ data <- "migr_asydcfsta" %>% get_eurostat %>% data.table save(data, file="data_asylum.Rdata") } load("data_asylum.Rdata") dic <- lapply(names(data), get_eurostat_dic) eumap <- rjson::fromJSON(file = "http://code.highcharts.com/mapdata/custom/europe.geo.json", method = 'C') for (i in 1:length(eumap$features)) { names(eumap$features[[i]][[3]])[names(eumap$features[[i]][[3]]) %in% "iso-a2"] <- "code" } data[, period := year(time)] data[, time := NULL] data <- data[age %in% "TOTAL" & decision %in% c("TOTAL", "REJECTED") & citizen %in% "TOTAL" & sex %in% "T", ] data[, geo1 := as.


Continue reading

In 2015 I was working on my master thesis “The integration of (QU)AIDS and input-output analysis in a panel data setting” and had to analyse the structure of household expenditure. I stumbled open several visualizations in The Economist (World and EU) while searching for information on this topic. Thinking that they looked great I wanted to replicate these with R. The way I chose to do it is based on the question in stackoverflow.
Continue reading

Happy school year! With a lot of of help from RSelenium I did some Wikipedia scrapping and gathered a data set on schools in Lithuania. According to the ministry of education where were 1151 schools in 2016-2017. Data set covers about 80(\%) of the total population. In this post only information that can be found in the Wikipedia and schools websites which are listed in it is presented. One can see three major peak periods: education reform (1777-1781), first independence (1918-1919), second independence(1991-1993).
Continue reading

Package rSymPy offers a nice possibility to do symbolic computation in R. In this post I want to suggest an alternative to it, which helped me out to derive some complex expressions of conditional moments for multivariate normal distribution. rSymPy was simply too slow for my tasks, so I remembered computer algebra system - Maxima. What is also nice, that this option also produces Tex output. In this post I will provide some instructions for Windows users.
Continue reading

Author's picture

Simona Jokubauskaite

Statistician, MSc

University of Natural Resources and Life Sciences, Vienna

Austria